

The Analytics overview
Read your covers, channels, and busy hours for any date range, and export the numbers.
Analytics turns your reservations into numbers you can act on: how many covers you did, where bookings came from, and when the room actually fills. Open the menu at the top left and choose Analytics under Grow. Every tab shares the same two controls at the top right: the date range and Export CSV, which downloads the current view's numbers for your accountant or your own spreadsheet.
The insight chips
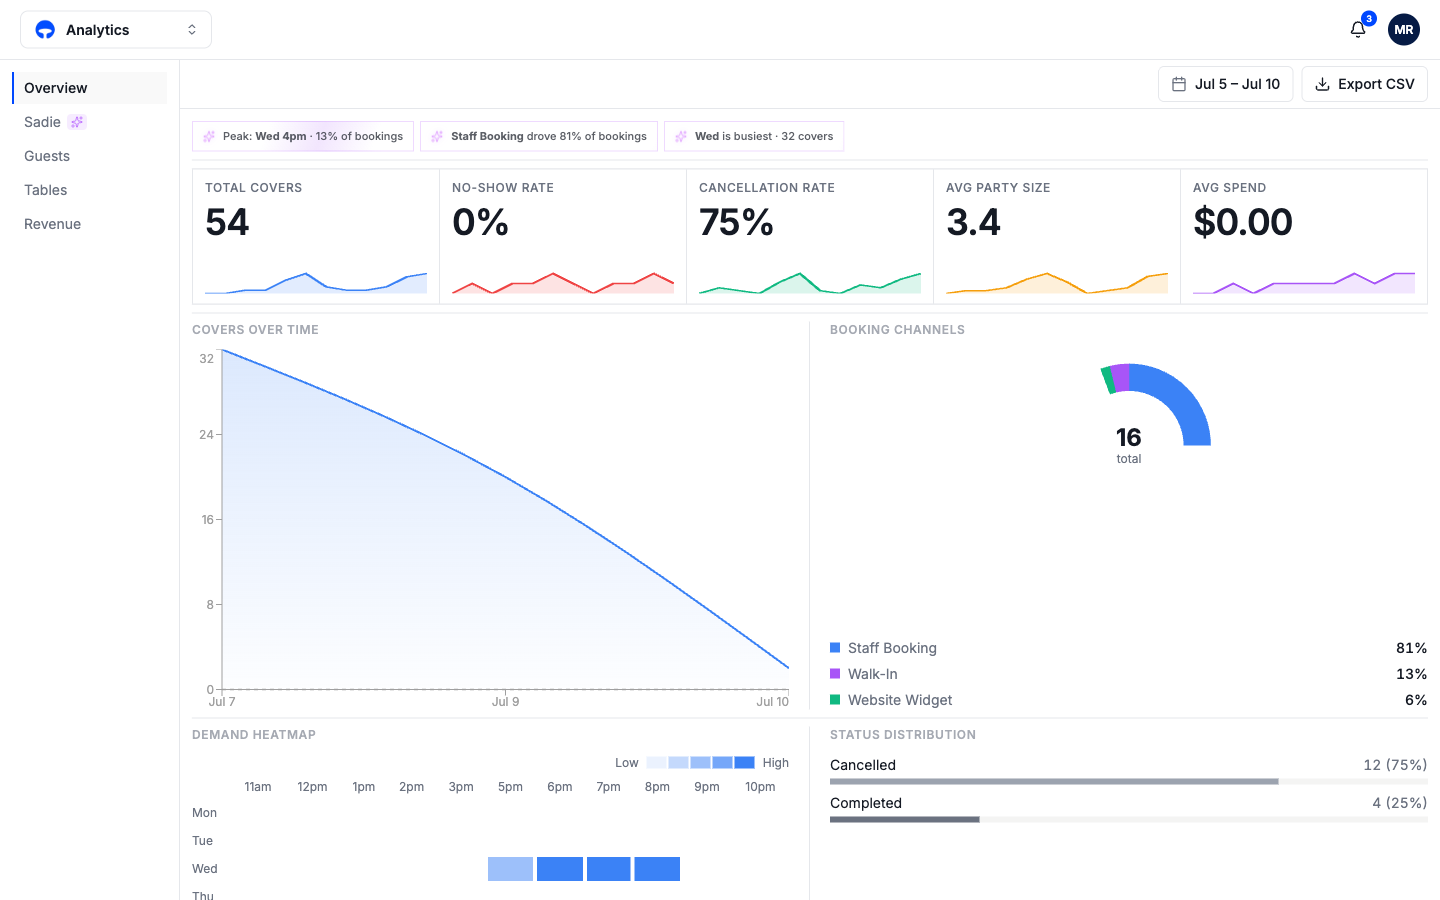
The row of chips above the numbers calls out what matters in the period without you hunting for it: your peak hour, the channel driving the most bookings, your busiest day. Read them first; they are the summary of everything below.
The overview numbers
Five tiles track the period, each with its own trend line: total covers, no-show rate, cancellation rate, average party size, and average spend. Spend stays at zero until a point of sale is connected; see Revenue and Sadie.
The charts
Covers over time shows the shape of the period day by day. Booking channels breaks bookings down by where they came from, staff, walk-in, your website, so you can see whether the widget is pulling its weight. Demand heatmap grids covers by day and hour; the dark cells are when to schedule your strongest floor team. Status distribution shows how bookings ended: completed, cancelled, no-show.
What's next
Go a level deeper with Guests and tables, or connect spend data with Revenue and Sadie. The Email tab rounds out the set: it tracks the booking emails Covers sends for you, confirmations and reminders, showing how each template delivers and gets opened.