

Guests and tables
Who is coming back, and which tables and zones earn their floor space.
Two Analytics tabs answer the questions behind the covers count: the Guests tab tells you whether people come back, and the Tables tab tells you whether the room works hard enough. Both follow the date range and Export CSV controls at the top right.
The Guests tab
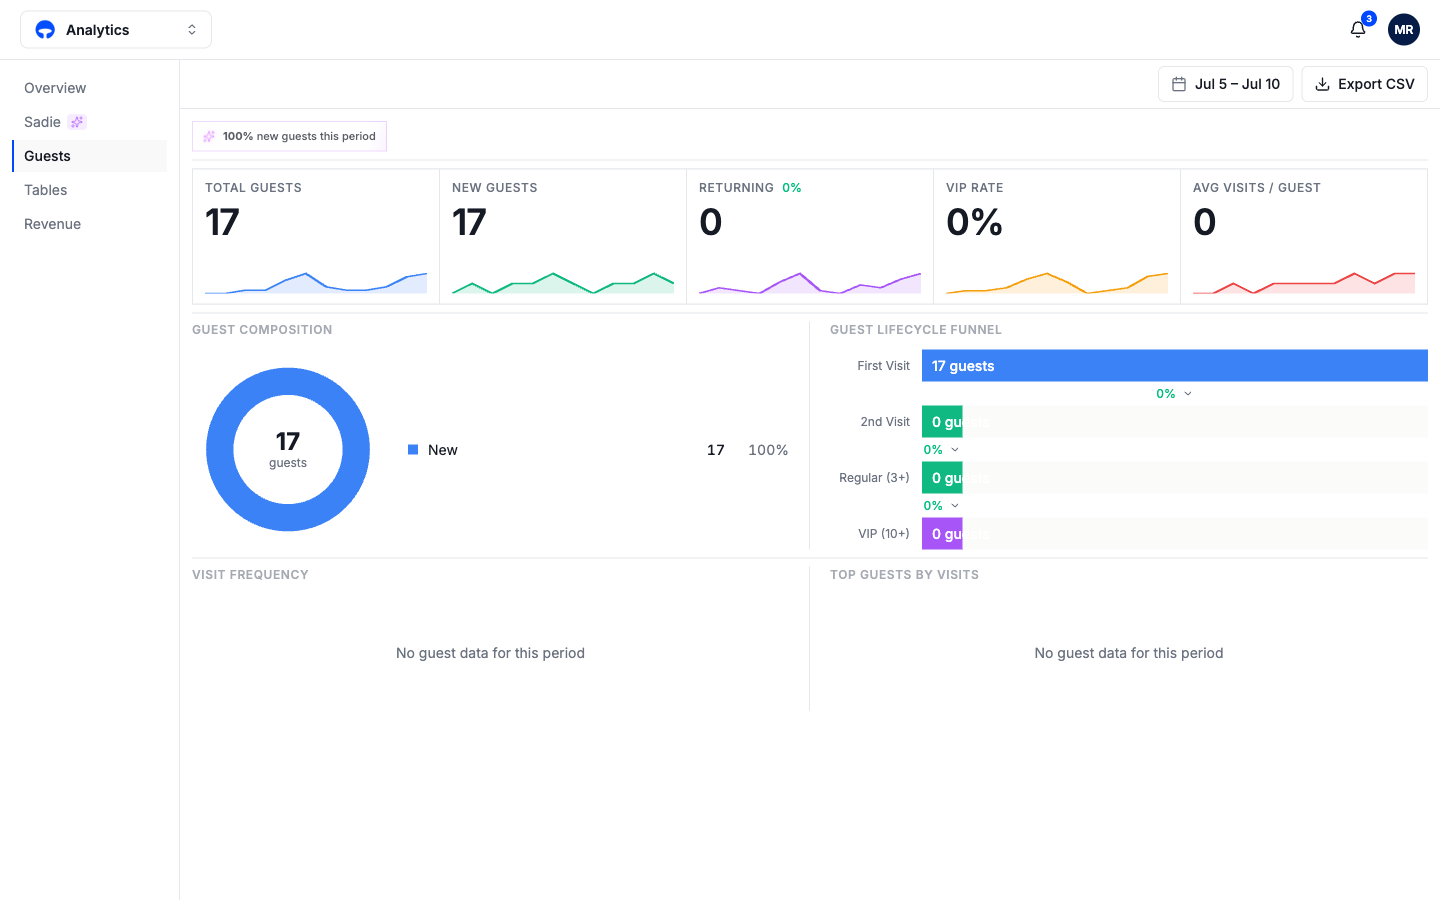
The tiles count total guests, new guests, returning guests, your VIP rate, and average visits per guest for the period. Below them:
Guest composition splits the period's guests into new and returning. A room full of new faces is great for a launch month and worrying for an anniversary.
Guest lifecycle funnel tracks the path from first visit to second visit to regular (3+ visits) to VIP (10+), with the conversion rate between each stage. The first-to-second-visit step is where most venues leak; it is the number your follow-up texts and wallet passes exist to move.
Visit frequency and top guests by visits name the people carrying the numbers. Your guest book is one click away for any of them.
The Tables tab
The tiles track total tables, covers, average utilization, average turn time, and turns per table. Below, table performance colors every table by how hard it works (75%+, 50 to 75%, under 50%), and zone performance with turn time by zone do the same by area. A zone that turns slowly at low utilization is layout feedback: the floor plan editor is where you act on it.